From Bytecode to AOT Cache, Part 2 - Warmup, Why the App Is Still Slow After "Started"
In part 1 we followed the JVM from java -jar app.jar to the moment main starts running: loading, linking, initialization, and where all of it lives in memory. At the end of that road, Spring Boot prints its proud little line:
Started PetClinicApplication in 5.534 seconds (process running for 6.123)Here is the trap I used to fall into: I read that line as "the app is fast now". It is not. The app is running, but it will run slowly for a while, because almost every method in it is still being interpreted, one bytecode instruction at a time. That slow period has a name, warmup, and part 1 only waved at it. This part is about what the JVM is actually doing during it, and it is the part of this series where I learned the most.
Before digging in, my understanding of the JIT was: the JVM watches which methods are called the most, and compiles those to native code so we skip the interpretation. That is correct. And what I knew about C1 and C2 was: C1 is the JVM converting bytecode to native code, and C2 is the JVM optimizing that native code even further. That is roughly the idea, but the details are different and they matter.
The interpreter counts
The interpreter does not just execute bytecode. It also counts. For every method it keeps track of how many times the method was called, and how many times loops inside it went around. When a method crosses a threshold, it is considered hot, and it is handed to a compiler.
Two compilers, C1 and C2
There are two compilers, and both of them produce native code from bytecode. The difference is how much effort they put in:
- C1 is fast. It compiles quickly and does the easy optimizations. The code it produces is decent, much better than the interpreter, but not the best possible.
- C2 is slow. It takes much longer to compile a method, but it does aggressive optimizations: inlining calls, removing checks it can prove are useless, and above all, using profiling data to make bets on how the code actually behaves.
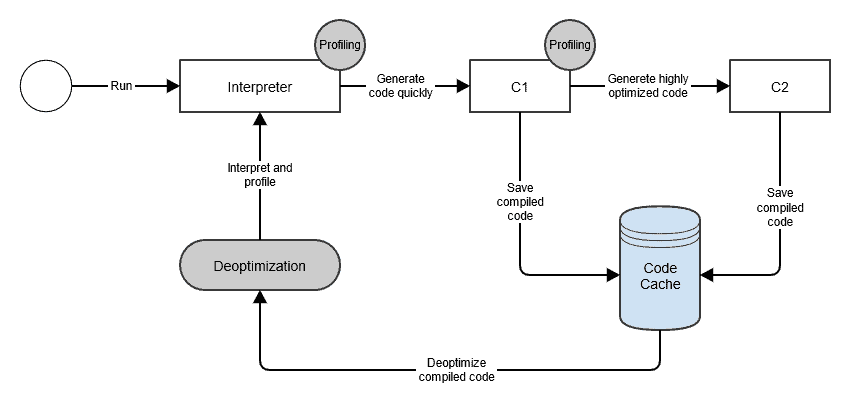
That last point is the key thing I was missing. C2 does not only look at the bytecode. It looks at what happened while the code was running in the interpreter and in C1: which branches were taken, which concrete types showed up at each call site, whether a value was ever null. If a call to list.add() only ever saw an ArrayList, C2 will compile that call as a direct call to ArrayList.add, with no virtual dispatch, and put a check in front of it in case something else shows up later. If the check fails, the JVM throws away the compiled code and goes back to the interpreter. This is called deoptimization. It is how C2 can be this aggressive without ever being wrong.
The whole loop looks like this. Both compilers save their output into the code cache (the native memory region from part 1), and deoptimization is the arrow back to the interpreter when one of C2's bets goes wrong:
Tiered compilation
So the JVM uses both compilers, in what is called tiered compilation. A method climbs through levels:
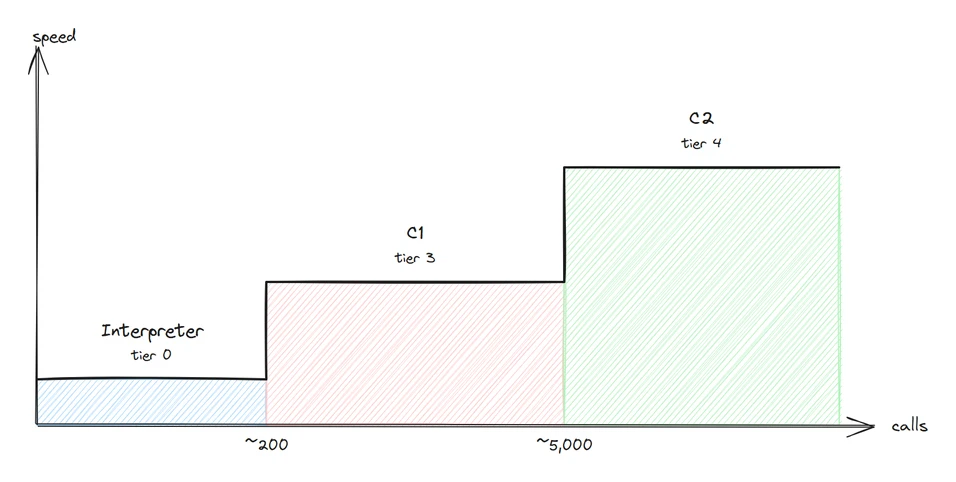
- Tier 0: the interpreter. Counts calls and collects a basic profile.
- Tier 3: compiled by C1, with extra code that collects a full profile for C2.
- Tier 4: compiled by C2, using that profile. This is the final, fast version.
(Tiers 1 and 2 exist too, but they are special cases: tier 1 is for trivial methods like getters where C2 would not help, tier 2 is used when C2 is too busy.)
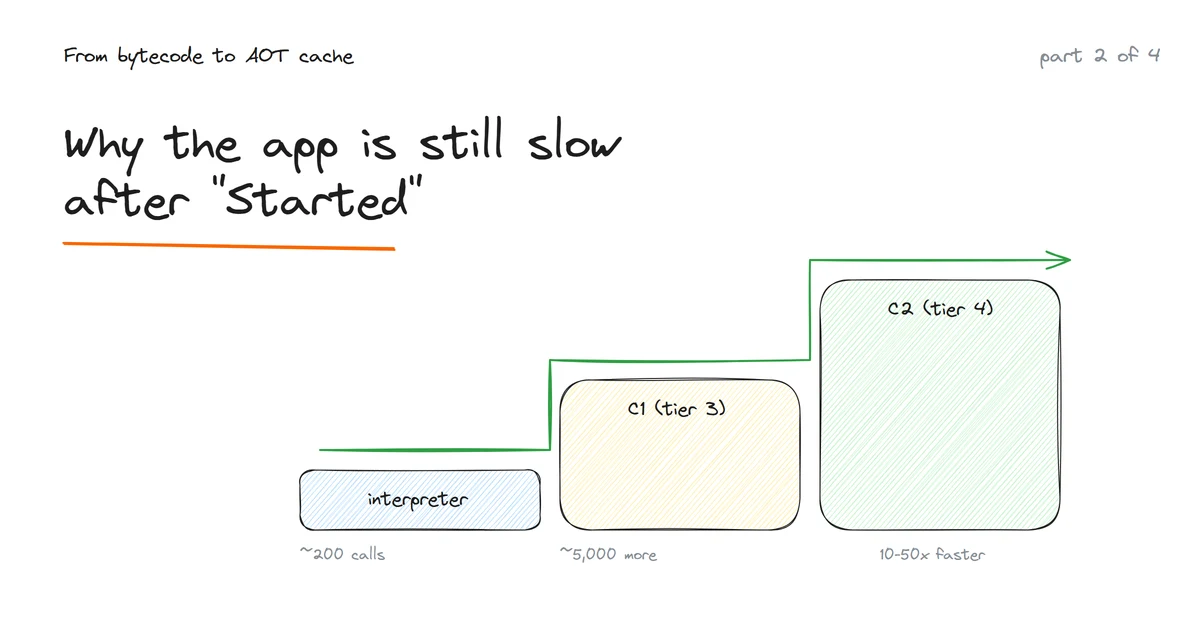
The default thresholds, on JDK 25, are Tier3InvocationThreshold=200 and Tier4InvocationThreshold=5000. Roughly: after about 200 calls a method goes to C1, and after about 5,000 more it goes to C2. Loops count separately, so a method called once with a big loop inside gets compiled too.
You can watch this happen with -XX:+PrintCompilation. I wrote a small program with a compute method called in a loop:
java -XX:+PrintCompilation Loop 33 14 3 Loop::compute (27 bytes)
34 15 % 4 Loop::compute @ 4 (27 bytes)
34 16 4 Loop::compute (27 bytes)
35 14 3 Loop::compute (27 bytes) made not entrant: not usedThe columns are: milliseconds since start, compile id, flags, tier, method. At 33 ms compute is compiled at tier 3 by C1. One millisecond later it is compiled at tier 4 by C2 (the % line is the JVM replacing the code of the loop while it is still running). And then the tier 3 version is marked made not entrant: nobody will call it anymore.
That is a tiny program, so it all happens in a few milliseconds. In a real application, compute is your request handler, your JPA repository, your Jackson serializer, and a few thousand other methods. Each of them needs its 200 and then 5,000 calls before it reaches its final form.
So why is warmup slow?
I used to think warmup was slow because the JVM had to profile all the methods. That is part of it: tier 3 code is slower than it could be because it spends time recording the profile, and C2 compilations eat CPU. But the bigger reason is simpler: until a method has been called enough times, it is not compiled at all, and interpreted code is 10 to 50 times slower than compiled code. A freshly started app is running almost entirely in the interpreter. The first requests are slow because they are literally being interpreted, one bytecode instruction at a time, while the JVM figures out what is worth compiling.
On a Spring Boot service, it typically takes somewhere between a few seconds and a few minutes of real traffic for the throughput to reach its steady state. That is warmup. And on Kubernetes it hurts twice: the pod that just started serves its slowest requests exactly when traffic is highest, and if the pod has a 1 CPU limit, the JIT compiler and your requests are fighting for the same core.
The same work, again
Step back and look at what warmup actually is. On every start of the same build, the same methods get hot. They cross the same thresholds in roughly the same order. The interpreter records the same profiles: the same branches taken, the same types at the same call sites. C1 and C2 compile the same bytecode, with the same bets, into essentially the same native code. And then the process exits, and the JVM throws all of it away.
That should sound familiar. It is exactly the conclusion of part 1, just one layer up: startup does identical work on every run, and now we know warmup does too. Two taxes, both paid in full, every single time a pod starts.
So, same question as last time: if the result is the same every time, why not do the work once, save it, and reuse it?
The JVM has been quietly answering that question for twenty years. The answer started with CDS, that mysterious "shared objects file" from the class-loading log in part 1, and it has grown, through Project Leyden, into the AOT cache: a file that carries loaded and linked classes and, since JDK 25, the method profiles the JIT needs to start compiling immediately instead of watching and counting first. That is part 3, and it is where those seconds finally start to shrink.
References
Some of what I watched and read while learning this:
- Just In Time (JIT) Compilers — Computerphile
- Tiered Compilation in JVM — Baeldung
- JVM Anatomy 101 — JetBrains