From Bytecode to AOT Cache, Part 1 - What the JVM Does When You Start Your App
At work, we run a lot of Spring Boot microservices on Kubernetes. They are not all the same size, and they do not all start at the same speed. The small ones start in about 4 seconds. The big ones take up to 20 seconds. When Kubernetes needs to scale up because traffic is coming in, 20 seconds is a long time to wait for a pod that is supposed to help right now.
So I started digging: why does a Java app take so long to start, and what can we do about it?
The short answer is a new feature of the JVM called the AOT cache, which comes from Project Leyden. With it, I got the Spring Petclinic sample app from 6 seconds to 2 seconds of startup, with no code change. But before getting there I had to understand a lot of things about the JVM that I had never really looked at. This series is that journey, written the way I understood it.
- What the JVM does when you start your app
- From CDS to Project Leyden: the AOT cache
- Spring Boot, fat jars, and the rules of the cache
- AOT cache by the numbers
In this first part there is no AOT cache at all. It is only about what the JVM is doing during those seconds, because the cache makes no sense if you do not know what it is caching.
Java is compiled and interpreted
This one I already knew, but it is the base of everything else so it has to be here.
When you run javac, you compile your .java files. But the result is not machine code that your CPU can run. It is bytecode, stored in .class files. Bytecode is a code representation that only the JVM understands. It is the same on Windows, Linux, macOS, x86 or ARM. That is the whole point: build once, run everywhere. You ship the same jar to any machine that has a JVM.
Then, when you run the app, the JVM reads that bytecode and translates it into something the machine it is running on can actually execute. That second step is the "interpreted" part.
Here is what bytecode looks like. Take this method:
public static int add(int a, int b) {
    return a + b;
}
Compile it and look inside the class file with javap:
javac Hello.java
javap -c Hello
public static int add(int, int);
Code:
0: iload_0
1: iload_1
2: iadd
3: ireturniload_0, iadd, ireturn. These are instructions for the JVM, not for your CPU. Something has to translate them at runtime.
What I did not fully realize before is that the JVM has two ways to do this translation:
- The interpreter reads the bytecode instruction by instruction and executes it. It can start right away, but it is slow, because it re-translates the same instructions every time they run.
- The JIT compiler (Just-In-Time) takes a whole method, turns it into real native code once, and from then on the CPU runs that native code directly. This is fast, but the translation itself costs CPU time.
The JVM starts everything in the interpreter and only compiles the methods that are actually used a lot. We will come back to this in the second half of the article, because it is the reason Java apps are slow after they start, not only before.
So a Java app pays two separate costs when it starts:
- Startup time: everything the JVM does before your code is ready to serve requests.
- Warmup time: the period after startup where your code is running, but slowly, because it is not compiled yet.
At work we mostly cared about the first one. But once you understand it, the second one is hard to ignore.
Startup: what happens before your app is ready
Before I looked into this, my mental model of java -jar app.jar was simple: the JVM loads the classes from the jar, and then it runs main. That is not wrong, but "loads the classes" hides three separate steps, and they are not equally expensive.
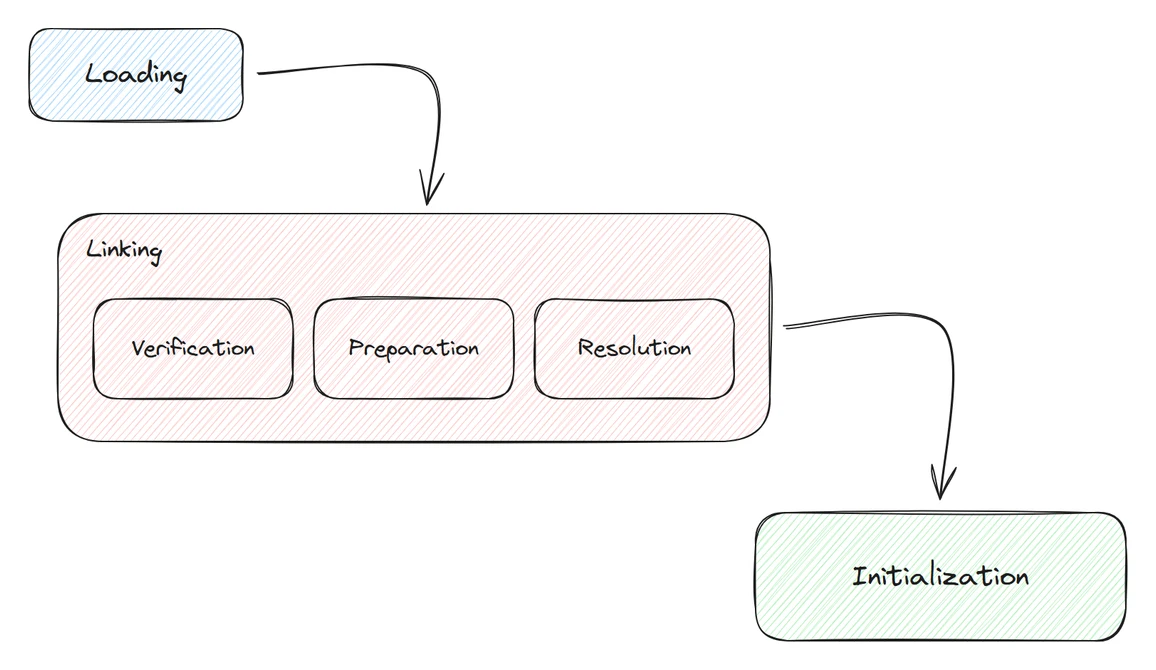
The JVM specification calls them loading, linking and initialization. Every single class goes through them, one by one, the first time it is needed.
Loading
This is the part I had right. The JVM finds the .class file on the classpath (in a directory or inside a jar), reads its bytes, and parses them.
What does "parse" mean here? A .class file is just a binary file with a known layout, and the JVM turns those bytes into something it can work with, the same way a JSON parser turns text into objects. You can see what is inside one with javap -v Hello.
The part worth understanding is the constant pool. It is a lookup table at the top of the file: every name the class ever refers to (class names, method names, strings) is stored there once, with a number.
Constant pool:
  #13 = Methodref   // Hello.add:(II)I
  #16 = Utf8        Hello
  #17 = Utf8        add
Why does this table exist? Because the bytecode itself never contains names. It never says "call Hello.add". It says "call #13", and entry #13 says "the method add of class Hello". Keep this table in mind, it comes back in the linking step.
The rest of the file is what you would expect: the fields, the methods with their bytecode (the iload_0, iadd... we saw earlier), and some metadata like the line numbers you see in stack traces.
Once parsing is done, the class exists in memory in two forms. The JVM builds its own internal representation, which is what it will actually use to run the code. And it creates one java.lang.Class object in the heap, which is the only form you can touch from Java: it is what Foo.class or obj.getClass() gives you.
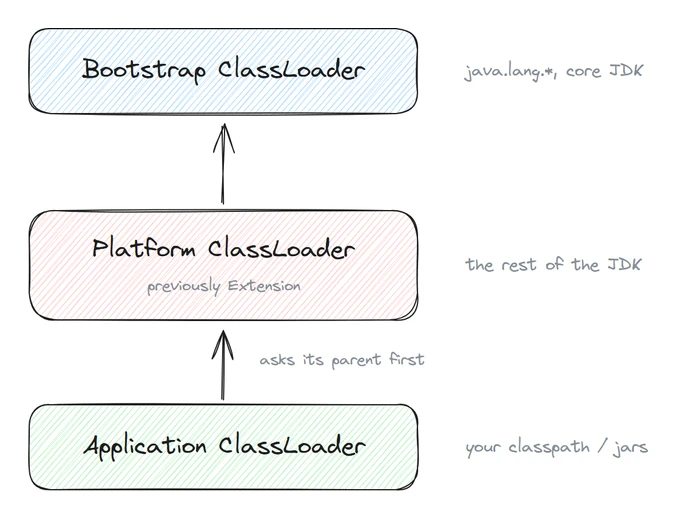
One thing worth knowing: the loading is done by a class loader, and there are several of them. The bootstrap loader loads the core JDK classes (java.lang.*), the platform loader loads the rest of the JDK, and the application loader loads your classpath. Frameworks can add their own. Spring Boot does exactly that: a fat jar is loaded by a custom class loader that knows how to read jars nested inside the main jar. This detail will matter a lot in part 3, so keep it in mind.
The loaders form a hierarchy, and each one asks its parent before loading anything itself. The reason is not to save work, it is identity: in the JVM a class is identified by its name plus the loader that loaded it. If two loaders each loaded java.lang.String, you would have two incompatible String types in the same process. Delegation guarantees one copy, owned by one loader. It also means you cannot shadow a JDK class from your classpath: the bootstrap loader always finds the real one first.
Linking
Here I was only half right. I thought linking was the JVM verifying the bytecode, and that is true, but it is only one of three things that happen in linking.
Verification. The JVM checks that the bytecode is valid and safe: types are consistent (you cannot add an object to an integer), jumps go to real instructions, final methods are not overridden, and so on. Verification is about the structure of the code, not about what happens when it runs. What surprised me is that verification is real CPU work: it is basically a type analysis of every method of every class. For a hello world it is nothing. For a Spring Boot app with more than ten thousand classes, it adds up.
Preparation. The JVM allocates the memory for the static fields of the class and sets them to their default values (numeric fields to 0, object references to null)..
Resolution. This is where the constant pool from loading comes back. The bytecode never says "call Hello.add". It says "call #13", and #13 is just a name written in the table: "the method add of the class Hello". A name is not something you can execute. And why store a name instead of a pointer to the method? Because when javac compiled the file, there was no running program and no memory. There was nothing to point to. Resolution is the lookup that fixes this at runtime: the first time the instruction runs, the JVM takes the name, finds the class (loading it now if nobody has used it yet), finds the method inside it, and saves the answer in place of the name. The second time, the answer is already there. This is one reason the first execution of any code path is slower than the second.
Initialization
This one I got wrong. I assumed initialization was the JVM creating an instance in the heap for every class it needs at runtime. It is not. The JVM does not create any instance of your classes on its own. Initialization is when the JVM runs the static initializers of the class: the static field assignments and the static { } blocks. This is also the moment static fields get their real values. Back in preparation, static int count = 5; was set to 0 like everything else; initialization is when the = 5 actually runs. It happens the first time the class is really used (you create an instance, call a static method, or access a static field).
Which means initialization is the only one of the three steps where your code runs. A static Logger field, a static Pattern.compile(...), a static map filled from a file: all of that runs during initialization, and it can be as slow as you make it.
Seeing it for yourself
I had never looked at what the JVM actually loads, so I tried it. The JVM has a logging flag, -Xlog:class+load, that prints one line per class it loads, in order, with where it came from. Here is a hello world on JDK 25:
java -Xlog:class+load Hello[0.019s][info][class,load] java.lang.Object source: shared objects file
[0.019s][info][class,load] java.io.Serializable source: shared objects file
[0.019s][info][class,load] java.lang.Comparable source: shared objects file
...
[0.038s][info][class,load] Hello source: file:/C:/dev/hello/Two things I did not expect.
First, the number. A program that prints one line loads 617 classes. My class is one of them. The other 616 are the JDK itself: strings, collections, the module system, System.out, and so on. A Spring Boot web app loads more than 10,000. Every one of them goes through loading, linking and initialization, and when the process exits, all of that work is thrown away. Next start, the JVM does it all again.
Second, that source: shared objects file. 613 of the 617 classes did not come from a jar or from the JDK's own class files. They came from something called a shared objects file. I had no idea what that was. It turns out the JDK has been shipping a pre-built archive of its core classes for years, so it can skip the loading and parsing for them. This is called CDS, Class Data Sharing, and it is the ancestor of the AOT cache. You can turn it off with -Xshare:off and see the difference: on my machine the hello world goes from about 180 ms to about 215 ms. Not a lot, but on a hello world there is not a lot to save. Part 2 starts from there.
If you want to count classes for your own app:
java -Xlog:class+load:file=classes.log -jar app.jar
# wait for "Started ..." then stop it
grep -c 'class,load' classes.log
Warmup: why the app is still slow after "Started"
Once main is running, the interpreter is executing your code. And the interpreter is slow. This is where the JIT compiler comes in, and this is the part where I learned the most.
What I knew
My understanding of the JIT was: the JVM watches which methods are called the most, and compiles those to native code so we skip the interpretation. That is correct. And what I knew about C1 and C2 was: C1 is the JVM converting bytecode to native code, and C2 is the JVM optimizing that native code even further. That is roughly the idea, but the details are different and they matter.
What actually happens
The interpreter does not just execute bytecode. It also counts. For every method it keeps track of how many times the method was called, and how many times loops inside it went around. When a method crosses a threshold, it is considered hot, and it is handed to a compiler.
There are two compilers, and both of them produce native code from bytecode. The difference is how much effort they put in:
- C1 is fast. It compiles quickly and does the easy optimizations. The code it produces is decent, much better than the interpreter, but not the best possible.
- C2 is slow. It takes much longer to compile a method, but it does aggressive optimizations: inlining calls, removing checks it can prove are useless, and above all, using profiling data to make bets on how the code actually behaves.
That last point is the key thing I was missing. C2 does not only look at the bytecode. It looks at what happened while the code was running in the interpreter and in C1: which branches were taken, which concrete types showed up at each call site, whether a value was ever null. If a call to list.add() only ever saw an ArrayList, C2 will compile that call as a direct call to ArrayList.add, with no virtual dispatch, and put a check in front of it in case something else shows up later. If the check fails, the JVM throws away the compiled code and goes back to the interpreter. This is called deoptimization. It is how C2 can be this aggressive without ever being wrong.
So the JVM uses both compilers, in what is called tiered compilation. A method climbs through levels:
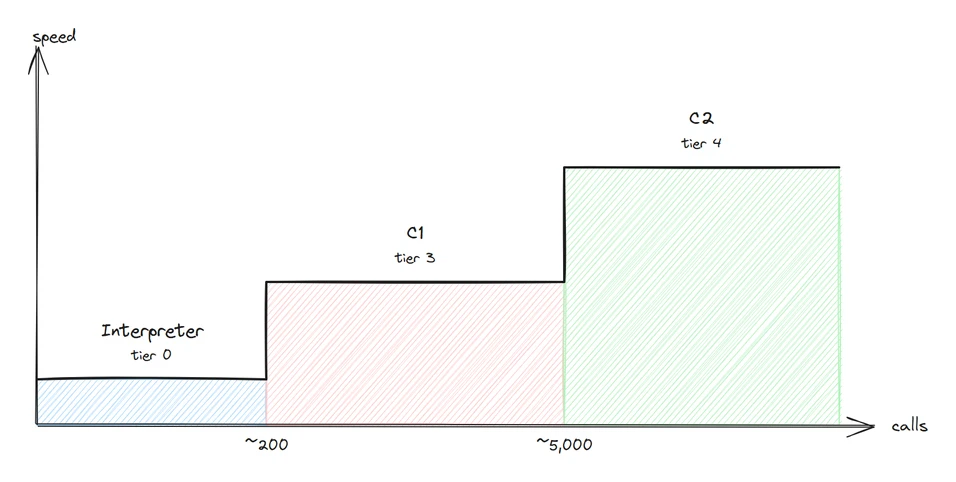
- Tier 0: the interpreter. Counts calls and collects a basic profile.
- Tier 3: compiled by C1, with extra code that collects a full profile for C2.
- Tier 4: compiled by C2, using that profile. This is the final, fast version.
(Tiers 1 and 2 exist too, but they are special cases: tier 1 is for trivial methods like getters where C2 would not help, tier 2 is used when C2 is too busy.)
The default thresholds, on JDK 25, are Tier3InvocationThreshold=200 and Tier4InvocationThreshold=5000. Roughly: after about 200 calls a method goes to C1, and after about 5,000 more it goes to C2. Loops count separately, so a method called once with a big loop inside gets compiled too.
You can watch this happen with -XX:+PrintCompilation. I wrote a small program with a compute method called in a loop:
java -XX:+PrintCompilation Loop 33 14 3 Loop::compute (27 bytes)
34 15 % 4 Loop::compute @ 4 (27 bytes)
34 16 4 Loop::compute (27 bytes)
35 14 3 Loop::compute (27 bytes) made not entrant: not usedThe columns are: milliseconds since start, compile id, flags, tier, method. At 33 ms compute is compiled at tier 3 by C1. One millisecond later it is compiled at tier 4 by C2 (the % line is the JVM replacing the code of the loop while it is still running). And then the tier 3 version is marked made not entrant: nobody will call it anymore.
That is a tiny program, so it all happens in a few milliseconds. In a real application, compute is your request handler, your JPA repository, your Jackson serializer, and a few thousand other methods. Each of them needs its 200 and then 5,000 calls before it reaches its final form.
So why is warmup slow?
I used to think warmup was slow because the JVM had to profile all the methods. That is part of it: tier 3 code is slower than it could be because it spends time recording the profile, and C2 compilations eat CPU. But the bigger reason is simpler: until a method has been called enough times, it is not compiled at all, and interpreted code is 10 to 50 times slower than compiled code. A freshly started app is running almost entirely in the interpreter. The first requests are slow because they are literally being interpreted, one bytecode instruction at a time, while the JVM figures out what is worth compiling.
On a Spring Boot service, it typically takes somewhere between a few seconds and a few minutes of real traffic for the throughput to reach its steady state. That is warmup.
Why this matters more today
For a long time nobody cared about any of this. A Java application server started once and ran for months. A few seconds of startup and a minute of warmup did not matter.
That is not how we run Java anymore. On Kubernetes, pods get restarted on every deployment, every node maintenance, every scale-up. When the autoscaler adds a pod because the existing ones are overloaded, that pod needs 20 seconds to start and then serves its slowest requests exactly when the traffic is highest. And if the pod has a 1 CPU limit, the JIT compiler and your requests are fighting for the same core during warmup.
What struck me when I understood all of this is that both costs come from work that has the same result every time. The same 10,000 classes are loaded, verified and linked, in the same order. The same methods get hot, with the same profiles, and get compiled to the same code. And then the process exits and everything is gone.
If the result is the same every time, why not do it once, save it, and reuse it on the next start?
That question is exactly what Project Leyden is about. In part 2 we will look at how the JVM has been trying to answer it: first with CDS (that "shared objects file" we saw in the log), then with the AOT cache in JDK 24 and 25. That is where the 6 seconds become 2.