From Bytecode to AOT Cache, Part 4 - Spring Boot, Fat Jars, and the Cache by the Numbers
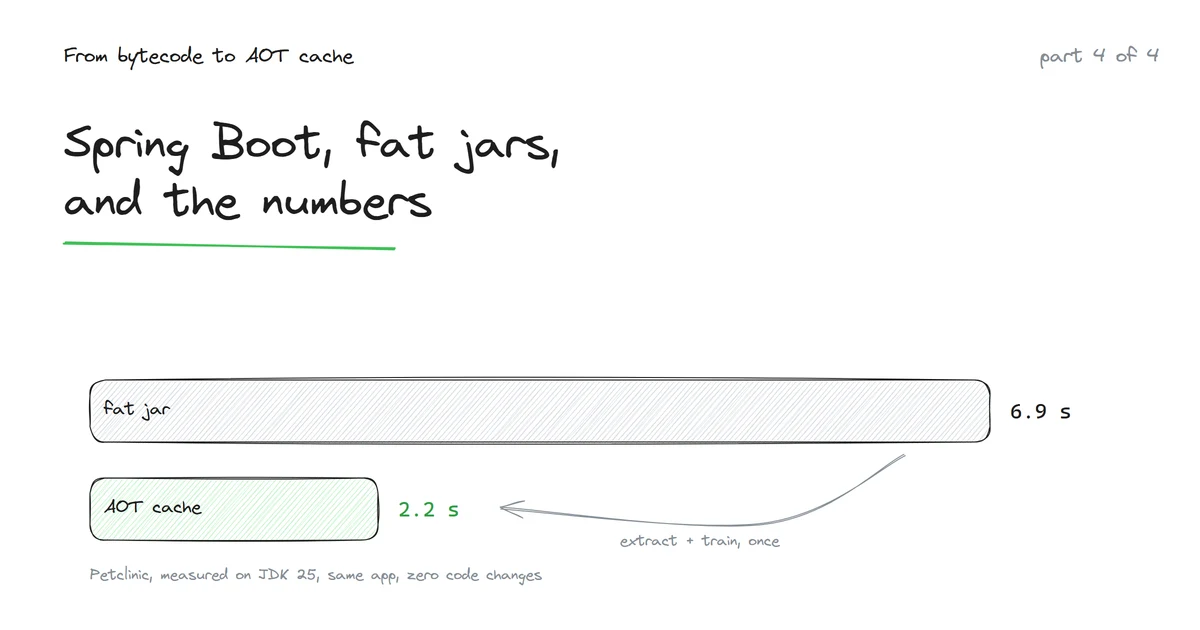
Part 3 ended halfway. The AOT cache on a fat jar took Petclinic from 6.9 seconds to 4.5, when the exact same cache, on the exact same app, can do 2.2. This part is about the missing half, because it goes back to a detail from part 1, and about the small set of rules you have to follow to get everything the cache can give. It ends with the numbers the whole series has been promising.
What is actually inside a fat jar
When you run mvn package on a Spring Boot app, you get one big "fat" (or "uber") jar. I had never really looked inside one, so here is Petclinic's jar, opened up:
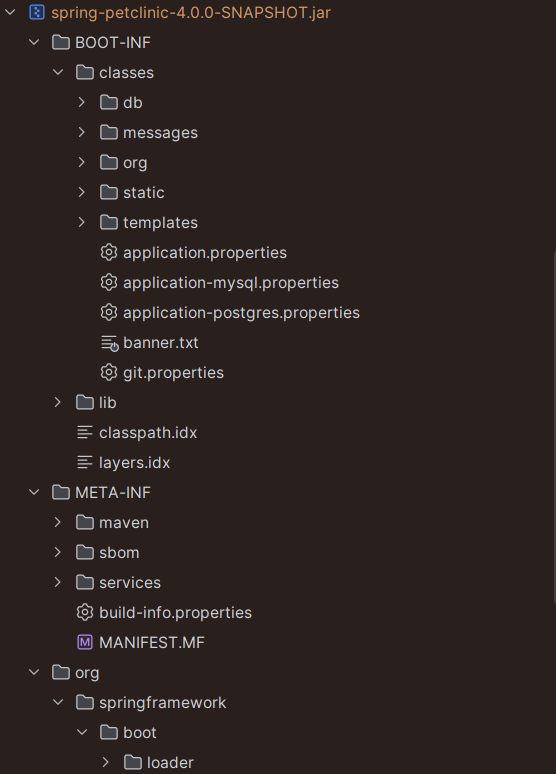
Three things live in there:
BOOT-INF/classes/: your code.BOOT-INF/lib/: your dependencies, as whole jars, nested inside the jar.org/springframework/boot/loader/: Spring Boot's launcher, the only part the JVM can see normally.
And META-INF/MANIFEST.MF is the giveaway, look at Main-Class and Start-Class:
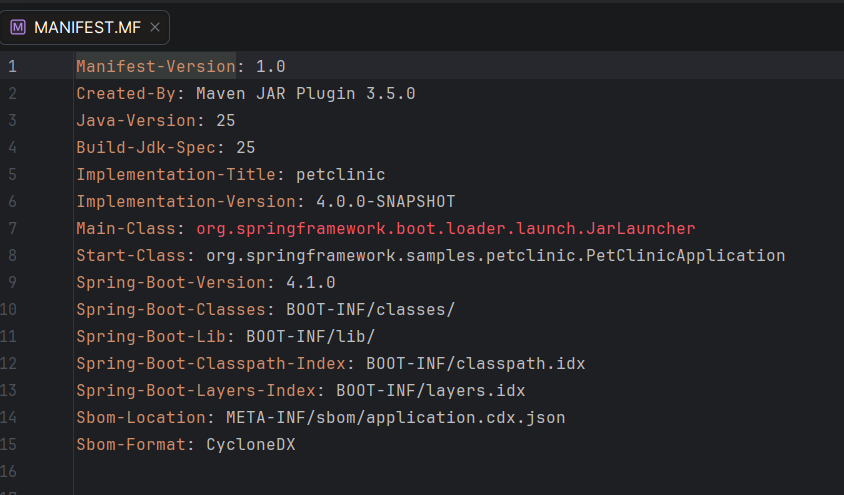
java -jar app.jar does not start your application. It starts JarLauncher, and JarLauncher creates the custom class loader I mentioned in part 1: one that knows how to read classes out of jars that are nested inside another jar, something the JDK's application loader cannot do. Only then does it call your main.
Why the fat jar only gets half
Now connect this to how the AOT cache works. The best thing the cache does, the thing that puts it above plain CDS, is storing classes already linked: verified, constant pools pre-resolved, owned by one of the three built-in class loaders from part 1.
And that is exactly what a fat jar cannot offer:
- Your classes and dependencies are loaded by
JarLauncher's custom class loader, not by the application loader. The cache still stores them, but the pre-linking only applies to classes owned by the built-in loaders, so they come back the old CDS way: unlinked, constant pools still symbolic. All the resolution work from part 1 stays on the startup path. - The jars they live in are not plain files on the classpath; they are entries inside another jar, and every start keeps paying for finding and decompressing them.
What surprised me is that the JVM barely complains. My fat-jar training run printed only 26 Skipping warnings, mostly dynamic proxies and a few classes that fail verification without their optional dependencies:
[7.582s][warning][aot] Skipping jdk/proxy1/$Proxy21: Unsupported location
[7.578s][warning][aot] Skipping org/springframework/boot/cache/autoconfigure/RedisCacheConfiguration: Failed verification
Everything else went in, 122 MB of cache. It just went in as second-class cargo. That is how you get 4.5 seconds instead of 2.2: the cache is working, but the linking part of it, the part that makes it more than CDS, is not.
The fix: stop being fat
Spring Boot's answer (since 3.3) is a jar mode that unpacks the fat jar into the layout the JVM wants. On Petclinic:
java -Djarmode=tools -jar spring-petclinic-4.0.0-SNAPSHOT.jar extract --destination applicationThis produces an application/ folder with a lib/ directory next to a much thinner jar. Open that jar: no more BOOT-INF, no more launcher, just the application's own classes and resources at the top level:
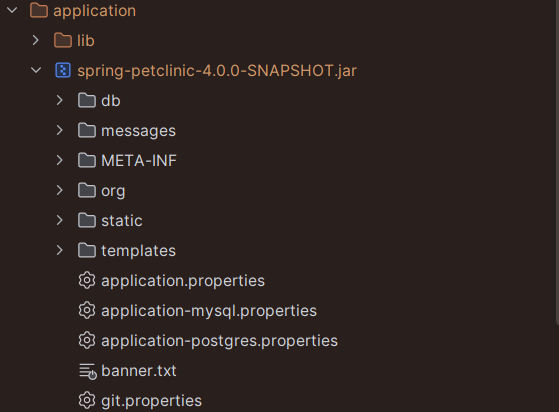
And the new manifest says it all. Main-Class is now PetClinicApplication itself, JarLauncher and Start-Class are gone, and every dependency that used to be nested is now a plain file listed on a good old Class-Path:
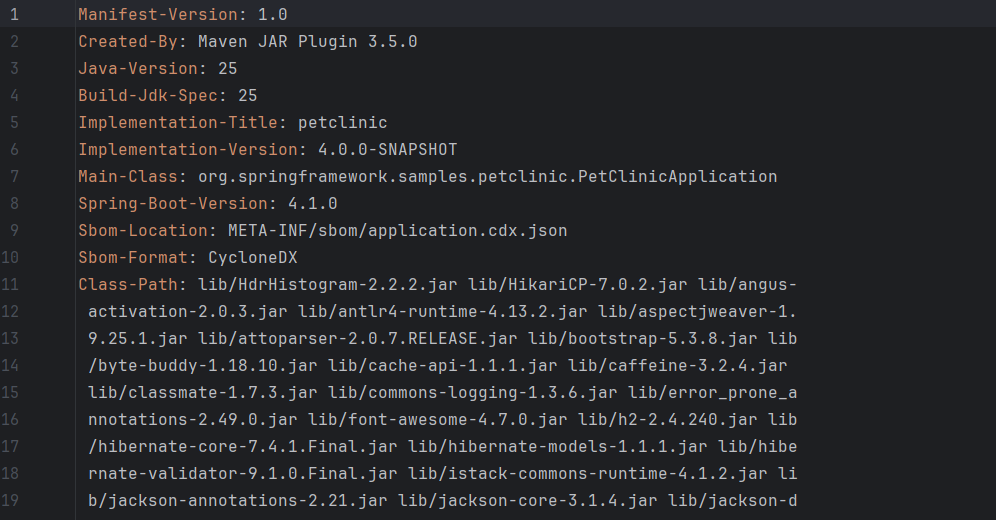
Nothing custom is left: java -jar application/spring-petclinic-4.0.0-SNAPSHOT.jar starts through the regular application class loader, exactly like the textbook case from part 1. Startup is even slightly faster before any cache is involved, because nobody is decompressing jars from inside a jar anymore.
The training run, done properly
With the extracted layout, the flow from part 3 works. One detail is worth doing right: the training run should exercise the same code path as production, and the cleanest trick is a Spring property that starts the full application context and then exits immediately, before serving anything:
java -XX:AOTCacheOutput=app.aot \
     -Dspring.context.exit=onRefresh \
     -jar application/spring-petclinic-4.0.0-SNAPSHOT.jar
That one command boots the app (so the JVM sees every class and every hot method of a real startup), exits, and writes app.aot. Production then runs:
java -XX:AOTCache=app.aot -jar application/spring-petclinic-4.0.0-SNAPSHOT.jarThe rules of the cache
Everything that made my first attempt fail generalizes into a short list. The cache is checked at startup, and if the world does not match the training run, the JVM silently falls back to doing the work itself, so each of these costs you the whole benefit:
- Same JDK. The cache format is tied to the exact JDK build. Update the JDK, regenerate the cache.
- Same OS and architecture. A cache made on your x86 laptop is useless in an ARM container. It stores memory-mapped native layouts, not portable data.
- Same classpath. Same entries, same order, same paths. Renaming a jar, adding one, or moving the app directory invalidates the match.
- Extracted layout, not the fat jar. The whole story above.
- Train like you run. Classes the training run never touched are not in the cache; a profile the training run never saw cannot warm up the JIT.
Rules 1 to 3 have one big practical consequence: the cache must be created in the same environment that will run it. Not on your laptop, not in a generic CI job. The natural place is the container build itself.
The Dockerfile
This is the shape I ended up with, a multi-stage build where the training run happens inside the image:
FROM eclipse-temurin:25-jdk AS build
WORKDIR /app
COPY target/spring-petclinic-4.0.0-SNAPSHOT.jar app.jar
# unpack the fat jar into the cache-friendly layout
RUN java -Djarmode=tools -jar app.jar extract --destination extracted

FROM eclipse-temurin:25-jre
WORKDIR /app
COPY --from=build /app/extracted/ ./
# training run: boot the context, exit, write the cache -- inside the final image's environment
RUN java -XX:AOTCacheOutput=app.aot -Dspring.context.exit=onRefresh -jar app.jar
ENTRYPOINT ["java", "-XX:AOTCache=app.aot", "-jar", "app.jar"]
I built exactly this image for Petclinic: both stages work, and the training run boots the full Spring context during docker build, with no network and no external database. It is also what produced the image sizes measured below.
Petclinic tolerates that because its default profile uses an in-memory database, and that is the one honest caveat: if your app touches the network or a database during startup, the training run inside docker build will try to do the same. The usual fix is a training profile that skips those beans, at the price of a slightly less complete cache.
By the numbers
Theory is done. The only honest way to close this series is to measure it: the same app, the same machine, with and without the cache.
- Machine: AMD Ryzen 7 5800X (8 cores), 32 GB RAM, Windows 11
- JDK: Oracle JDK 25.0.1 (build 25.0.1+8-LTS-27)
- App: the Petclinic jar from above, fat and extracted
- Startup metric: wall-clock time of the whole run, from launching
javato a fully refreshed application context, using-Dspring.context.exit=onRefreshso the process exits on its own. 2 throwaway runs, then the median of 10 measured runs. - Warmup metric: latency of the first requests after start, measured against
GET /owners?lastName=
One honest note before the tables: these are measurements from my desktop, not from a Kubernetes pod. The absolute numbers on a 1-CPU pod with a cold container filesystem will be worse across the board. But the relative improvement is the interesting part, and if anything, the cache helps a constrained pod more than it helps my 8 idle cores: the work it removes is exactly the work that fights your requests for CPU during startup.
Startup
| Configuration | Startup (median of 10) | vs baseline |
|---|---|---|
| Fat jar, nothing | 6.88 s | - |
| Fat jar + AOT cache | 4.50 s | -35% |
| Extracted, no cache | 5.44 s | -21% |
Extracted + AppCDS (-XX:ArchiveClassesAtExit) |
3.22 s | -53% |
Extracted + AOT cache (-XX:AOTCache) |
2.22 s | -68% |
Three things jump out of this table:
- Extraction alone is worth 21%, with no cache involved at all. That is the pure price of reading jars nested inside a jar, paid on every single start.
- The fat jar with a cache gets stuck at 4.5 seconds: the halfway result that opened this article. The cache stores its classes, but without the pre-linking, and without fixing the nested-jar reading.
- The full combination is a bit more than 3x: 6.9 seconds down to 2.2. Reading it against part 3's ladder: extraction gives the layout, AppCDS-style loading gives the next chunk (3.2 s), and pre-linking plus warm JIT profiles take it to 2.2.
Warmup
Startup is what we just measured; warmup is what your users feel. So I started the extracted app, with and without the cache, and timed 300 sequential requests to GET /owners?lastName= from the moment the app was up:
| First request | Requests 1-100 (avg) | Requests 201-300 (avg) | |
|---|---|---|---|
| No cache | 494 ms | 15.4 ms | 5.9 ms |
| AOT cache (with JEP 515 profiles) | 392 ms | 14.8 ms | 6.3 ms |
I will be honest: I expected more. The first request is about 20% faster with the cache, and after that the two curves are the same, the small differences are noise. But this result makes sense, and it is worth understanding rather than hiding. Warmup, from part 2, is the time until the JIT has compiled your hot methods. On my idle 8-core desktop, the JIT catches up in a couple of seconds no matter what: there is always a free core to compile on. The cached profiles from part 3 pay off in the situation my machine is not in: a pod with a 1 CPU limit, where the JIT and your requests fight for the same core and every compilation the cache makes earlier or cheaper is a request that does not stutter. Warmup on this table is the healthy-machine case; the Kubernetes case is exactly where it should look better.
What it costs
Nothing is free; here is the bill:
| Cost | Measured |
|---|---|
Cache file size (app.aot) |
124 MB |
The AppCDS archive, for comparison (app.jsa) |
97 MB |
| Training run + cache creation | 2 min 12 s |
| Image size increase (same Dockerfile without the cache steps) | +158 MB (598 MB -> 756 MB) |
| Extra memory at runtime (working set just after start) | +29 MB (337 MB -> 366 MB) |
The limits, honestly
- The cache helps startup and early warmup. Steady-state performance is identical, and the warmup table above shows it: once the JIT has done its job, both configurations run the same code.
- The gain scales with class count: a hello world saves milliseconds, a 10,000-class Spring app saves seconds. Small services gain less.
- Every JDK update, dependency change or classpath change means regenerating the cache; the Dockerfile above makes that automatic, but the training run is now part of every build.
- Static initializers (part 1) still run on every start. If your startup time is dominated by your own code, connecting to things, reading files, warming internal caches, the cache cannot help with that part.
The end of the road
This series started with a pod taking 20 seconds to help during a traffic spike. The road went from bytecode and class loading (part 1), through the interpreter and the JIT (part 2), to the cache that saves all that repeated work (part 3), and finally to the packaging rules that let Spring Boot actually use it.
The headline is simple: 6.9 seconds to 2.2, more than 3x, with zero code changes. One extract command, one training run, two JVM flags. What I would tell my past self is that none of it is magic: every second the cache saves is a second I could name by the end of part 1, spent parsing, verifying and resolving the same 10,000 classes that were exactly the same yesterday.
What comes next for the JVM is more of the same idea: Project Leyden is already testing caching the JIT's compiled code itself, not just the profiles. The gap between "JVM starts" and "JVM is fast" keeps shrinking, and everything in that gap was always work that produced the same result on every run. It just took twenty years of redoing it every time before saving it became the default plan.
References
Some of what I watched and read while learning this:
- Packaging: AOT Cache — Spring Boot reference documentation
- Java AOT in Production at Netflix — Java (official channel)
- Project Leyden — OpenJDK